Discrete and Fast Fourier Transforms
Visually and mathematically

I recently started doing some work on audio files and signal processing most of what relies upon the Fourier Series. Now if you’ve taken a Calculus course you’d probably dealt with this. But I think people don’t appreciate Fourier Transform as much it is capable of, although this post will get you started in the right direction for Audio Signal Processing I first want to talk a little more about the power of the Fourier series especially in drawing things because that’s the coolest and then move onto Discrete Fourier Transform (DFT) and Fast Fourier Transform (FFT).
Drawing pretty much anything.
Well yeah! You can draw pretty much anything when it comes to Fourier Series. So Fourier Series is given by :

As you can see that this formula has a complex term j, now most of the formulas you must have seen regarding the Fourier Series are simple (as no complex terms), that's usually a choice, you can write this equation in terms of sine and cosine but you’ll have to calculate the integral twice rather here you just need one integral but with a complex term so it’s sort of a trade-off. But after reading about Fourier, mostly the complex form is preferred over the simple form and we will be working on this form of the equation only. Now, how do you go from that monstrous (actually elegant) formula to this:

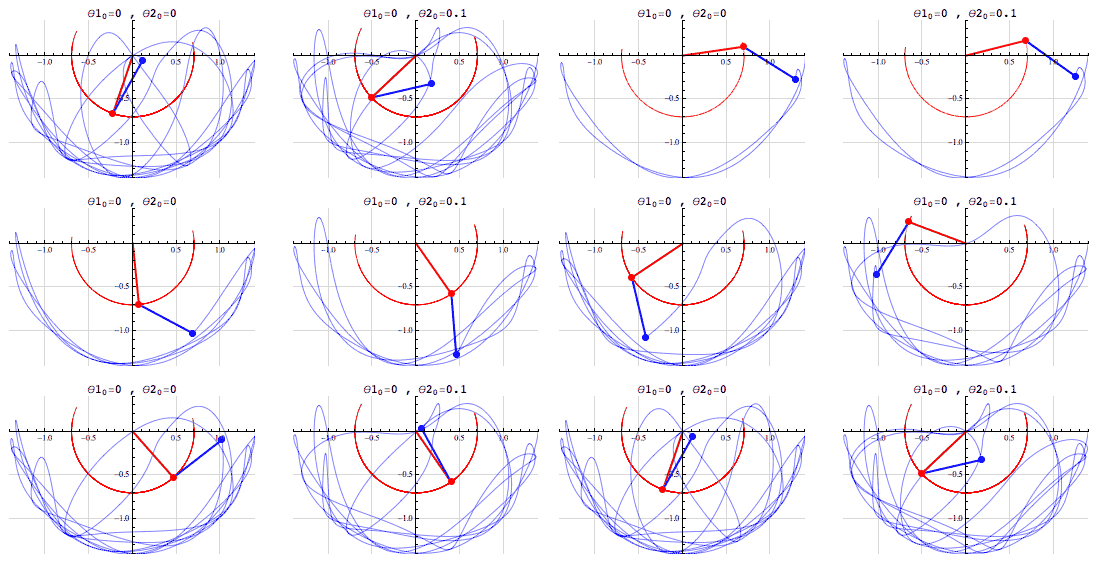
It’s quite challenging to imagine these things but I’ll try my best to explain, if you are still confused by this I urge you to watch a video by 3Blue1Brown which does a classy job in giving a very detailed description with a stunning visualization. So if you chose to stick with me here we go, imagine a pendulum now if we take the bob from its equilibrium position and raise it keeping the string fully stretched we are giving it potential energy and when we release it's converting that potential energy to kinetic energy. Simple right! Now imagine a double pendulum, when we had a single pendulum the track of movement was defined but in the double pendulum, it’s totally random. Here the theta is the angle between the principle and the string.


Now, when it comes to Fourier Series we can represent it as the sum of individual elements. The exponential part describes the rotation:

Now these individual elements are just vectors and y are the positions so y(0) will decide the position in accordance with the origin. These vectors join each other head to tail to produce a wave that can be controlled by setting different values for the exponential and the y term.

Discrete Fourier Transform
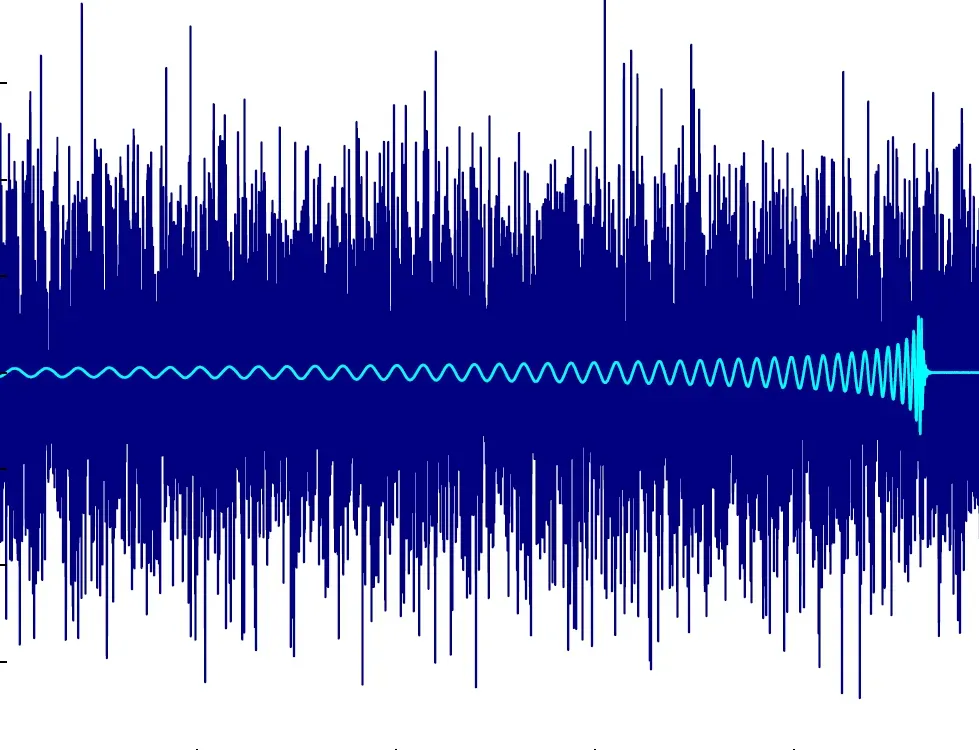
Now let’s talk about the other application of Fourier Series, which is the conversions from the time domain to the frequency domain. The reason we do this is that when we plot amplitude vs the time it looks kinda complex and when we do it against frequency it's more interpretable. Here look at white noise for example,

But who cares about white noise, let’s get some Passionfruit by Drake.

So you see, with a plot between amplitude vs frequency is more interpretable than the time chart. This was done through DFT. So let’s see how that worked. Fourier Transform can be represented as:

Now the limits are from infinity to infinity which is kind of impossible to calculate. So instead we represent it as a sum of the terms, so it’s easier to compute, which is the discrete method:

And we can further shorten the equation by :

And we can represent the full series by :

Now there is no point in using this because it has an exponential and a complex term so it’s of no use unless you have a lot of time, but let’s be smart here. One thing we can use to reduce the exponential to cosine and sin by Euler’s Formula.

After using this rule we can make of the previous equation as:

And get the magnitude using L2, and the phase using theta. But the problem it’s not continuous and we get breaks in our result and if we miss one point our result would be off, but to get a continuous result we would have to use infinite as the limit. One more problem is that is method is super slow if you see closely it take O(n*n) time complexity. Now if you see this table O(n*n) is really bad as the value of n grows.

Now the next method we will see has the complexity of O(n*logn) so let’s go. Also, the graph can be plotted using this magnitude. One of the most important concepts in signals is the Nyquist Limit in which limit is the sampling frequency/2 and we ignore every frequency above the limit and doubling every frequency below the limit.
Fast Fourier Transform
Now let’s talk about the Faster algorithm, we first start by redefining some constants so let’s go.

Now we will divide the set into two parts odd and even set. So the even index can be represented 2r and odd index is given by 2r+1 where r is 0,1,2…N/2 -1 but why? Well you can also do other things like bitwise swapping or reversing the index the key is just to get a random sequence but it should be possible to trace it backwards. After that, we can represent our series as even and odd parts.


Now the parts under the summation are the same but they represent two separate parts of the one odd and another even. And hence we can summarize the equation as the following:

Now we need to calculate X[k] which are our magnitudes, so first as we did earlier we will divide the entries into sets of odd and even index and then we will get the DFT of the sets, so as we know from the Nyquist Limit the output will be only the first half so if the sampling frequency is 8 for both odd and even we will get the first four entry and then we proceed to multiply it with the corresponding odd and even values given by the following diagram.

Now the outputs can be plotted wrt the frequency to get an optimized solution.
Additional Links
Code for the visualization(it hasn’t been uploaded yet but I’ll make some more tweaks and upload ASAP): https://github.com/kaustubherttre/fourier-transform
Visualizing Fourier Transform: https://youtu.be/r6sGWTCMz2k


